 BeMined
threejs R package
The threejs R package provides interactive 3D scatterplots and globe plots using Three.js. More examples are available at the threejs gallery.
Interactive 3D graphics by the threejs package
Data Projector

Data Projector visualizes High-Dimensional Data with SVD, t-SNE and Three.js. A live demo of this code is available at http://opensource.datacratic.com/data-projector/
Data Projector powered by Three.js
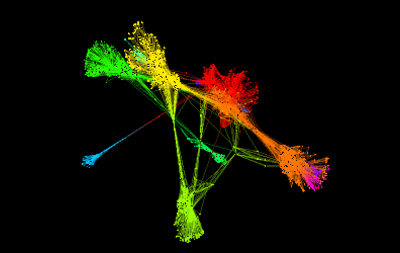
Software Galaxies
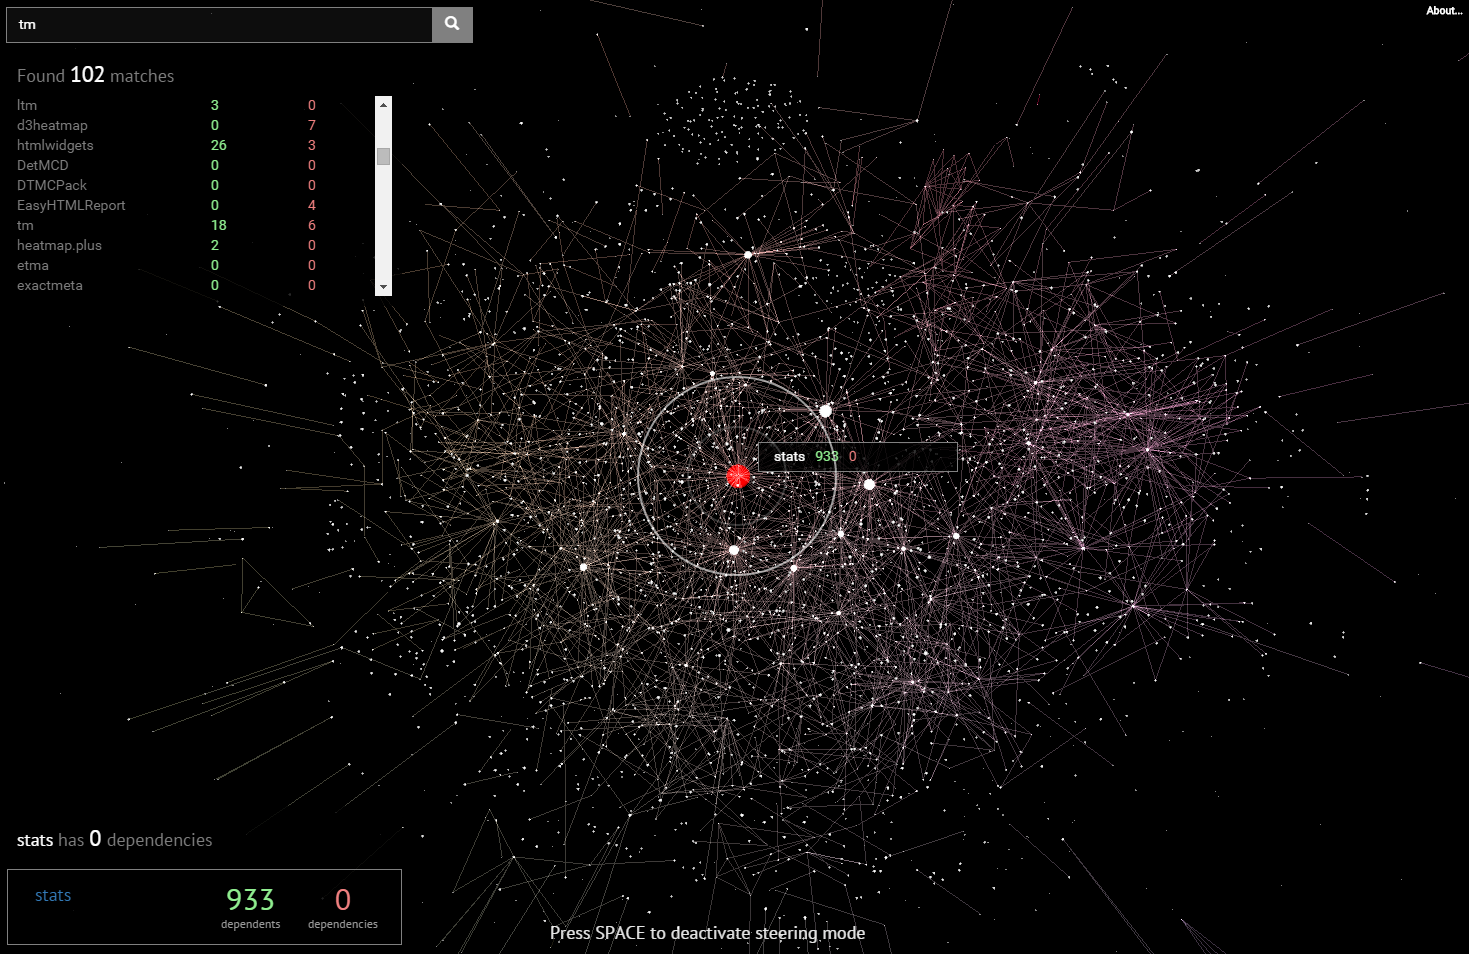
Software Galaxies provide 3D visualizations of major software package managers: Python, CRAN package network of R packages, npm and others. All visualizations are available at http://anvaka.github.io/pm/#/
Software Galaxies: 3D CRAN Network Graph - R Language
Software Galaxies: GitHub

Software Galaxies example: GitHub followers 3D visualization showing all GitHub users who have more than two followers
Software Galaxies: 3D GitHub followers visualization